

Interest rates are in the driver’s seat…
Executive Summary:
Interest Rate Shock and Macroeconomic Headwinds: The bond market is experiencing a severe, rapid adjustment with yields reaching multi-decade highs, driven primarily by an expanding term premium rather than runaway inflation. This spike in real rates, combined with elevated fuel prices and unprecedented global debt levels, creates the potential for a significant drag on economic growth and is applying additional pressure to both the housing market and corporate credit.
Eroding Equity Market Breadth: While headline equity indices remain near all-time highs, this resilience is masked by extreme top-tier concentration, where just ten companies account for 40% of the S&P 500's market capitalization. Beneath the surface, market internals are rapidly deteriorating, with a significant portion of stocks trading below their moving averages, leaving equities highly vulnerable to a further valuation de-rating if yields push even higher.
A Contrarian Case for Sovereign Bonds: Despite the aggressive tightening of financial conditions and widespread bearish sentiment toward duration, bonds are becoming increasingly attractive from a contrarian perspective. With 10-year real yields hovering near 2008 crisis levels, Treasuries and other high-quality credit now offer a substantial cushion against future price declines and have historically delivered strong positive returns following similar yield peaks.
Full Commentary:
To understand how equities, commodities (excluding oil), precious metals, and bonds will play out for the remainder of the year and into 2027, investors need look no further than the bond market. Yields across the globe and throughout the Treasury curve have broken out to multi-decade highs, creating a gravitational pull that is weighing on all asset classes. The average yield on government bonds worldwide has touched 4% for the first time since 2007. Domestically, the 10-year Treasury note recently jumped above 5.25%, adding to a staggering 20-basis-point surge last week. It now sits just a few basis points away from eclipsing its June 2007 high—the peak that preceded the Great Recession. Meanwhile, the long bond is trading near 5.57%, marking its highest level since 2004.
The primary concern is not just the absolute level of these rates, but the violent speed of the adjustment. The economy is experiencing a severe interest rate shock, compounded by a concurrent fuel shock, particularly in diesel. It is difficult to pinpoint exactly what will halt this ascent, but a stabilization needs to happen soon and will likely require concrete evidence of economic and equity market deterioration. Under new Chair Kevin Warsh, the Federal Reserve signaled a desire to step back, allowing markets to price interest rates without the constant spoon-feeding of forward guidance. However, this hands-off approach has coincided with a severe tightening in financial conditions, a supply shock, and a flattening yield curve. The Warsh Fed appears deeply consumed with cementing its credibility and independence, seemingly willing to risk an outright recession to achieve its 2% inflation target. Historically, a tightening cycle occurring alongside a supply shock—without the fiscal stimulus offsets seen in 2022 and 2023—has almost universally generated recessionary conditions.
The pivotal macroeconomic question remains whether the tailwinds of a stable labor market, recurring fiscal deficits, and the monstrous AI capital expenditure cycle can overpower the headwinds of higher interest rates, elevated energy prices, and cumulative inflation to propel nominal GDP.
Within the equity market, a tale of two cities has emerged. Investors fixated on the major averages see one reality, while those analyzing the underlying market internals see an entirely different landscape. While headline indices have performed well in 2026, the average stock has languished over the past several months. The S&P 500 has become unprecedentedly lopsided: just 10 companies now account for 40% of its total market capitalization, and the top 20 command a staggering 50% share. This heavy top-tier concentration conceals the fact that the equal-weight index is down more than 5% from its mid-August highs and has remained completely flat since mid-June.
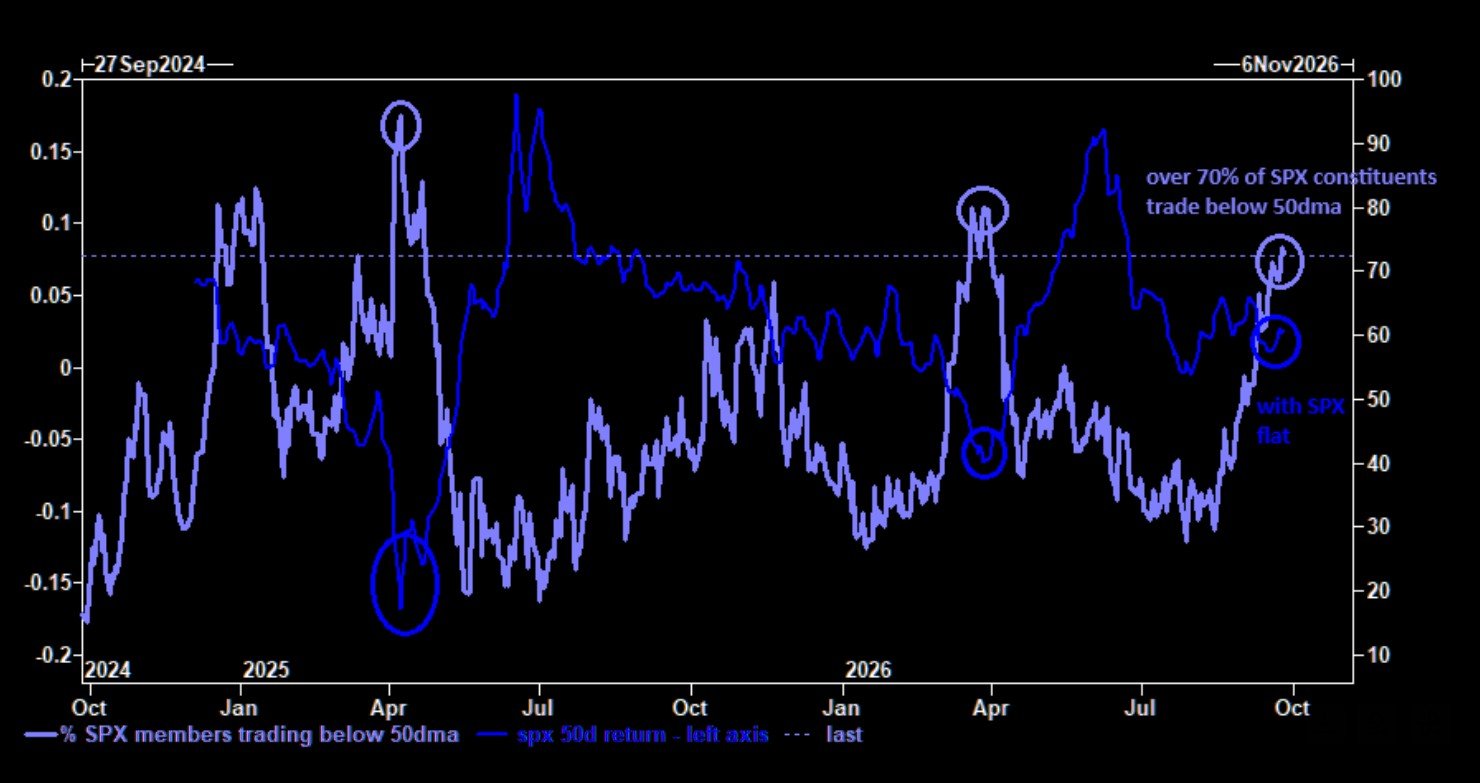
Cracks are forming beneath the surface for those actively monitoring technical market breadth. When evaluating advancing versus declining momentum through quantitative lenses like the NYSE McClellan Oscillator or the Summation Index, the underlying erosion becomes highly apparent. For instance, only 26% of S&P 500 constituents are currently trading above their 50-day moving averages, and less than 50% are above their 200-day moving averages. Furthermore, over 40% of Russell 3000 stocks have plummeted 20% or more since June. This is a textbook case of eroding market breadth.
Despite these warning signs, maintaining a measured and balanced perspective on capital markets is imperative. Sustained high fuel prices, a strong U.S. dollar, and a fragmented geopolitical order—colliding with surging interest rates—undeniably create a toxic recipe for risk assets and the broader economy over the next 12 months if they persist. Yet, the resilience of both the economy and the S&P 500, which remains roughly 2% off its all-time high, cannot be ignored.
Valuations have also adjusted to reflect these emerging risks. The forward P/E ratio for the S&P 500 has compressed by over three points, dropping from over 22x at the start of the year to 19x heading into Q3 earnings. While this multiple compression is partly a repricing of the aforementioned risk factors, it is also fundamentally supported by earnings per share (EPS) that are projected to grow by 25% to 30% in calendar year 2026.
So, if and when I’m forced to take a stance on which side of the ledger I stand, I remain in the camp of the bulls—albeit a nervous one, but part of that is just my professional disposition when tasked with the responsibility of managing other people's money.
Before closing the book on the current equity setup, it is worth examining a recent market breadth chart from Goldman Sachs. According to their methodology, market breadth is plunging toward its worst levels since the bursting of the Tech Bubble in 2000.
One could easily look at this data, conclude that market internals are disastrous, and brace for an imminent crash. Conversely, viewing this through a contrarian lens suggests that breadth is reaching such extreme, washed-out levels that the bulk of the pain has already been priced in, positioning the market for a bullish reversal. I align with the latter view. Historical data illustrates that similar, severe breadth washouts have frequently coincided with the S&P 500 nearing a durable shift back to the bullish side (see chart below).
Let’s dig into the mechanics of this interest rate move and explore the bond market a little deeper. The principal reason the bond market has become unglued is an epic shift in Federal Reserve policy expectations. Consider the whiplash in the Fed’s Summary of Economic Projections (the “dot plot”): as recently as March, they were signaling a rate cut. By June, the dots shifted to indicate one hike, followed by renewed easing in 2027. Then, the September update threw cold water on the market by projecting an additional rate hike by December, with tighter policy following through into next year.
Understandably, the markets are no longer taking any chances and are aggressively pricing in a higher-for-longer regime. The exact same bond market that was discounting two rate cuts just over six months ago is now predicting nearly an additional +100 basis points of tightening over the next year, on top of the hikes we have already absorbed. That recalibration alone justifies a parallel +100-basis-point upward adjustment across the entire yield curve.
As mentioned, we are now staring down the barrel of nearly four implied rate hikes for the coming year, occurring at a time when the yield curve was already perilously close to full inversion. This abrupt tightening of financial conditions cannot be construed as good news for the macroeconomic growth outlook. When yields bottomed in late February, markets were confidently positioning for at least one cut. The reversal since then represents the mother of all hawkish shifts.
Yet, here is the most fascinating aspect of this bond rout: despite relentless chatter about inflation re-accelerating, it simply has not materialized in market-based inflation expectations. At roughly 2.34%, 10-year TIPS breakevens are comfortably within the range of the past half-decade. In fact, breakevens are sitting at the exact same level they were on March 9th of this year, when the nominal 10-year yield was down at a benign 4.12%.
What does this tell us? The entirety of this +100-basis-point surge in yields has been driven by the "real rate" or an expanding term (risk) premium. Investors clearly realize there have been minimal second-round effects bleeding into core inflation, wages, or long-term consumer inflation expectations. The bond market isn't demanding higher yields because it fears runaway inflation; it is demanding higher yields to compensate for the fundamental risk of holding long-duration debt in a structurally higher-rate, deficit-heavy environment.
You can see for yourself in the following two charts the sheer magnitude of this surge across the tenor of the Treasury curve. The daily chart highlights the rapid ascent to 4.92% on the 2-year, 5.22% on the 10-year, and 5.52% on the 30-year. Meanwhile, the long-term historical chart provides sobering context, showing exactly where these current yield levels stand relative to the past 25 to 35 years, with the 10-year and 30-year actively testing their critical pre-Great Recession peaks.
This recent move in yields is not fundamentally about inflation, which is increasingly a one-trick pony tied to energy costs. Rather, the story lies in real rates. When real rates gap up above the prevailing level of real GDP growth, they act as a deadweight drag on the broader economy. By way of background, the nominal yields quoted on screens every day are a function of expected future inflation plus the incremental return investors require to hold Treasuries—the latter being the "real" rate of interest.
The following chart, clipped from the always-thoughtful Nicholas Colas at DataTrek, perfectly illustrates this dynamic. It maps 10-year inflation expectations (in red) against real, ex-inflation yields (in black) from 2023 to the present.
A few critical takeaways emerge from this data:
At the October 19, 2023 peak for 10-year yields (4.98%), embedded inflation expectations and real rates were perfectly balanced at 2.49% each.
Fast forward to today: with the nominal 10-year yielding 5.18%, real yields have surged 36 basis points to 2.85%, while forward inflation expectations have actually fallen 16 basis points to 2.33%.
Current real 10-year Treasury yields of 2.85% are now higher than at any point since 2003, with the singular exception of the absolute depths of the 2008 Financial Crisis, when they peaked at 3.15% on November 21, 2008.
Seeing real 10-year Treasury yields hovering at 2008 crisis levels is uncomfortable and demands an explanation. The most bullish interpretation is simply that the U.S. economy remains remarkably robust, allowing the Fed to keep short-term yields higher for longer, which trickles up the curve. We can attribute this unique economic resilience—which is shoving real rates into largely uncharted territory—to a combination of persistent labor shortages and massive, price-insensitive capital expenditure in AI infrastructure by Big Tech and venture capital. Conversely, the bearish explanation centers on the sheer magnitude of budget deficits here and across the developed world. However, the fact that U.S. equities continue to hold near all-time highs suggests the market is currently siding with the bullish argument. Given the critical importance of the wealth effect to consumer spending, equity investor confidence acts as a vital fulcrum for future economic growth.
Further out the curve, the real yield on the 30-year bond sits at 3.22%—a record high for this maturity going back to its launch in February 2010. This is cause for pause, to say the least. While nominal coupons across the Treasury curve appear highly attractive on the surface, investors have been badly scarred by this relentless yield melt-up. Many prognosticators are now calling for a further drift higher into the 5.50% to 6.00% range. That would eclipse the peaks seen in the summer of 2007, and history reminds us that spasms in the bond market inevitably infect all other asset classes with a lag.
If there is a silver lining for bond investors (assuming there are any left), it is that a 2.85% real yield on the 10-year and 3.21% on the long bond provide a massive cushion against future price declines. The math is vastly different than in 2021, when real yields were aggressively negative (-100 basis points on the 10-year and -60 basis points on the 30-year).
The bad news for the broader economy, however, is that these elevated real rates will eventually act as a critical brake on growth. We can marvel at the AI spending binge, but mortgage rates crossing back above 7% (up from 6% in late February) are absolute kryptonite to a housing market already paralyzed by acute affordability constraints.
Furthermore, the potential for a vicious cycle between deficits and yields is becoming alarming. Rising yields create an imminent risk of a negative feedback loop because the risks surrounding federal interest expense are skewed sharply to the upside. As the accompanying Wolfe DC Policy chart highlights, the Treasury's current average interest rate paid on public debt is 3.49% (already up 13 basis points from FY25). The Congressional Budget Office (CBO) models its fiscal outlook on the assumption that this average will merely drift toward a terminal rate of 3.9% by 2036. Yet, as the chart makes glaringly obvious, nearly the entire Treasury yield curve is currently trading hundreds of basis points above that CBO projection, with the long end pushing past 5.5%.
We should all be deeply concerned about the trajectory of fiscal policy, not just domestically, but globally. World debt across all sectors soared by $10 trillion in the first half of 2026 alone, reaching a nosebleed level of $365 trillion. That translates to an astonishing 310% of global GDP. Let that sink in: global debt is more than three times the size of the global economy.
Financing this extreme liability at a 5% baseline interest rate is a vastly different reality than funding that same largesse at 2%. The last time market interest rates were at today’s levels back in 2007, total world debt was only $142 trillion and represented less than 270% of the global economy. From a refinancing perspective, the systemic risks are exponentially more acute today. One has to wonder how much longer corporate credit spreads can remain at such remarkably tight levels—and how it is possible that, against this backdrop of fiscal instability, gold hasn't already blown past its early 2026 highs.
I suggest investors keep a very close eye on the market for corporate credit, as early strains are beginning to emerge. The average yield on non-investment grade debt is rapidly heading toward 8% for the first time since the initial tariff scare in April 2025. High-yield spreads have widened by 40 basis points in just the past month, pushing above 280 basis points—their widest level since early April. Investment-grade debt has behaved better, but even there, spreads gapped out last week by the most in over a month.
While credit spreads broadly reflect investor sentiment, the reality is that companies fund their operations and capital expenditures based on the actual nominal yield, and the cost of corporate debt is sharply on the rise. When the government issues debt, it is ultimately funded by future tax revenues; when the business sector issues debt, the added interest expense drains directly from current revenues and earnings. This is a critical distinction, and it marks the exact point where leveraged AI capital expenditures will begin to face hard financial constraints.
As a natural contrarian, I am starting to find bonds increasingly attractive here. I readily admit that this yield spike could overshoot further, but the current psychology feels eerily similar to the stock market in March 2009, when it seemed like prices would simply never bottom. This is about more than just the adage that "nothing moves in a straight line"—it is about the underlying math. We have seen 5%+ yields on the 10-year Treasury before, but only a handful of times over the past three decades. Historically, there has never been a time following such a peak where the 10-year note failed to deliver a net positive return twelve months later. In those instances, the mean forward return was +8.5% and the median was +6.5%. I understand all the fundamental reasons to shun duration right now, but sentiment and market positioning have reached a bearish extreme. Furthermore, with the current yield cushion, the only way a bond investor fails to make money over a 12-month horizon is if the 10-year relentlessly marches to 6%. If that scenario unfolds, there will be far worse places to be invested than government bonds.
Currently, the bond market is severely under-owned by real-money investors, heavily shorted by speculators, and the general public is entirely spooked by the speed of the rate shock. One might reasonably ask: why stretch out to the 10-year to gain an incremental 30 basis points of yield when you can hide at the ultra-short end of the curve at nearly 5%, clipping a coupon with zero duration risk? I completely understand that rationale. However, the curve is now pricing in four rate hikes for the coming year, and consensus has entirely swallowed the Fed’s refrain that the economy is unequivocally “solid,” “strong,” and “resilient.” While those adjectives accurately describe the economy over the past twelve months, our work suggests they are the wrong descriptors for the year ahead. The forward outlook now has to contend with the lagged effects of a 100-basis-point spike in real rates, precisely as GDP growth is set to cool from its Q3 peak. It’s the rate of change that is rolling over, and in financial markets, the rate of change is always what matters most. The chatter about structural inflation and excessive debt is ubiquitous, which is a classic case of pundits retrofitting their macroeconomic narratives to match the recent price action. We must remember that large-scale deficits and structural debts were just as present in March when the 10-year yield was sitting peacefully at 4.15%.
Looking ahead, bonds and equities are highly likely to move in tandem—both on the upside and the downside. A deeper sell-off in bonds could trigger a much more severe adjustment in share prices, especially given that the equity risk premium and credit spreads remain hovering near historical lows despite the aggressive tightening of financial conditions. To put it bluntly: I believe any further rise in interest rates from current levels will hurt equities far more than bonds. While both asset classes will move together, the bond market has already taken the pain and repriced for a ‘higher for longer’ regime. Conversely, the equity market is still treating this rate shock as transitory, stubbornly hoping yields will settle somewhere lower than where they are today.
Up to this point, pristine corporate balance sheets have supported those tight credit spreads. That, in turn, has helped keep the equity risk premium suppressed even as the entire yield curve shifted upward. But we have reached a critical threshold. A further bond sell-off would likely force a broad de-rating of equity valuations and profit growth expectations across the entire market, even if underlying earnings remain resilient in the narrow group of sectors directly benefiting from AI and infrastructure demand.
The concentration at the top of the market has become so extreme that, as one market observer quipped this week, "who knew a good hedge for long stocks was just being long the SPX." It is a joke that highlights the absurdity of the cap-weighted index masking the internal deterioration beneath it.
All of this raises a pressing question as we head into the fourth quarter: will this wall of worry finally give way to a year-end performance chase as institutions are forced to square their positions? There are plenty of potential catalysts to ignite it—perhaps it will be clarity following the November midterms, a blowout round of mega-cap tech earnings, or an unexpected geopolitical détente in the Middle East. Whatever the catalyst may be, it is worth remembering a timeless market truth: after years in the trenches, the market never gives you the "all clear" signal without making you pay for it in missed performance.
The articles and opinions in "Capital Market Musings and Commentary" are for general information only, and not intended to provide specific investment advice. Performance, dividends and other figures have been obtained from sources believed reliable but have not been audited and cannot be guaranteed. Past performance does not ensure future results. Investing inherently contains risk including loss of principle. Advisory services offered through Casilio Leitch Investments, an SEC registered investment advisor. Copyright © 2023 Casilio Leitch Investments. All Rights Reserved.